Business opportunity Russia
  • B2B Directory
    • Search
    • Join our B2B directory
    • Company promotion
    • Contact
  • Services
  • Blog
    • Company introduction
    • Publications

dataanalysis

Excel speedometer chart figure 1
Trainings

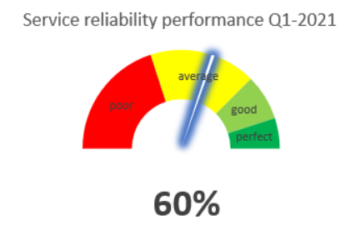
Upgrade your Excel skills: A smarter way of visualizing your data in Excel

Visualizing data in Excel by creating charts and graphs.

By Ngoc Tran, 2 years25 February 2022 ago
Comparison lead time and cost in Excel
Business tools

Analyze data in Excel with a case study of Dry Port to Dry Port (Part 3)

Analyze data in Excel and visualize data by using Excel Charts.

By Ngoc Tran, 2 years21 October 2021 ago
Data analysis in Excel
Business tools

Analyze data in Excel with a case study of Dry Port to Dry Port (Part 2)

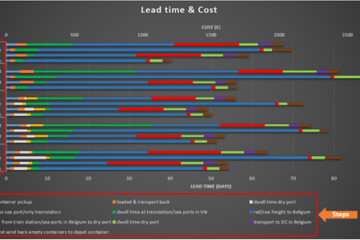
Data analysis in Excel with a case study of Dry Port to Dry Port (Part 2)

By Ngoc Tran, 2 years7 October 2021 ago
Data analysis Logistics
Business tools

Analyze data in Excel with a case study of Dry Port to Dry Port (Part 1)

Practical example on how to collect, clean and analyse data in Excel.

By Ngoc Tran, 2 years27 September 2021 ago
Featured companies
  • Business Crossroads Consultancy
Follow us
  • Twitter
  • RSS Feed
  • Google

SUBMIT POSTS to USER BLOGS

  • Home
  • About
  • News and tools
  • Company promotion
  • Terms and conditions
  • Privacy policy
  • Contact
  • Business information
  • Business tools
  • Country study
  • Events
  • Projects
  • Trainings
  • USER BLOGS
  • Twitter
  • RSS Feed
  • Google

  • @ business-opportunity-russia.com
  • All rights reserved.
Hestia | Developed by ThemeIsle